Six Sigma - Tools
Creating a SIPOC Chart

February 12, 2025
 Reverse Logistics & SCM – Scope and Advantages
Supply Chain Management is concerned not only with the flow of raw materials and finished goods, but scope extends beyond this to include reverse flow of unsold finished goods, parts and packaging materials from the point of consumption at customer’s end back to the organization or to rework/refurbishing vendors. Today reverse logistics has been adopted […]
Introduction to Flow Chart as BPI Tool
Business Process Improvement programs have become the major tools for Organizations to keep working on their internal operations to enhance the operational efficiencies, to implement new processes in line with business requirement and to eliminate redundancies and wastage. When the Organizations used to be managed and run based on hierarchy and centralized decision making, the […]
Six Sigma as a Strategic Tool
As mentioned in the earlier articles, Six Sigma helps the organization develop at various levels viz. operational, tactical and strategic. While the operational and tactical goals of cost reduction and increased customer satisfaction are well understood and appreciated, the strategic intent behind Six Sigma is not well recognized. It is the pivotal factor, however in […]
IT Disaster – Prevention, Precaution and Recovery
Disaster Recovery and Business Continuity concepts are more relevant to IT and technology companies as well as the service industry that is dependent upon technology as their backbone than any other industry. The reason being that IT systems, network, hardware as well as software and communication systems etc are highly sensitive and vulnerable and hence […]
Designing and Developing Decision Support Systems
The business intelligence tools or decision support systems aid decision making in an organization. An effective DSS provides you with unbiased data analysis, real time monitoring and rich reporting, supporting you make an informed decision in the least possible time span. A meticulously designed DSS makes use of analytical models, various statistical and econometric tools […]
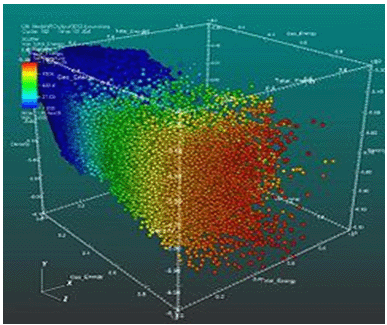
A scatter plot is a graphical tool. It has been designed to ensure that it provides a convenient view of the process to the manager at a single glance. The scatter plot studies the correlation between the important variables. When it studies the correlation between two variables, it is called a bivariate scatter plot. When there are multiple variables involved, it is called a multivariate scatter plot.
Correlation is the degree to which two variables simultaneously vary. A good example would be that whenever the cycle time is high, customer dissatisfaction is also high. Correlation is recorder on a scale of +1 to -1. +1 shows perfect correlation, while -1 shows perfect negative correlation. However, perfect correlations do not exist and if you come across one, it should be doubted.
Suppose the two variables were being recorded and measures and a high degree of correlation existed, it would provide useful information to the management to run the business better.
Correlation is often confused with causation. This may or may not be the case in reality. Just because we have the statistics to show that the two variables tend to move in tandem does not mean that we have proof that one causes the other. Implying causation could lead to inadvertent losses.
Correlation must be used only when at least one of the variables is under control. This variable will be known as the independent variable. Hence experimenters can vary one variable and record the other variable to determine the extent of the correlation.
Management has to forecast the levels of many variables before they agree on a budget. Correlation helps the management come up with the possible levels of these variables so that accurate budgets can be developed.
Scatter plots provide an important tool for visualization. This is because many times points that are farther away from where most of the points are scattered have the capability of influencing the correlation co-efficient which is the summary statistic. To avoid errors which may prove to be costly scatter plots are used.
A scatter plot is a set of X and Y axes. One variable is given the x axis and the other one is given the y axis. Each point on the graph has a value corresponding to the x and y axis i.e. both the variables. In case of 3 dimensional or multivariate analyses, more axes are introduced. However such visualizations are complex and require the use of complex software.

Your email address will not be published. Required fields are marked *