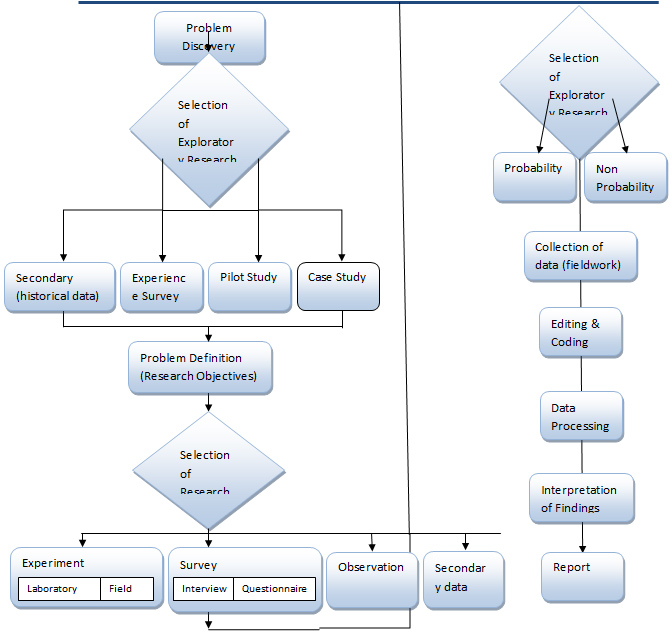
The main purpose of marketing research is to lower the uncertainty and risk in marketing decision-making. To achieve this, several stages are followed which are depicted in the flow diagram below.
Let us look at each stage meticulously.
- The research process begins with a brief from the client. Client may find a research partner if he is faced with a problem or has a decision to make. Unless he has a clear idea about the situation at hand, exploratory research (described in the previous chapter) needs to be undertaken to define the problem correctly and to frame the research objectives.
- Exploratory research can be conducted by:
- Secondary Data: analyzing Company’s historical data or literature review.
- Experience Survey: Involves taking expert opinion to gain knowledge on the topic.
- Pilot Study: Undertaking a mini research project on the lines of the full fledged one.
- Case Study: Finding insights to structure the problem by referring similar cases in other companies or a past resembling situation within the same company.
- Next step is to decide on the research design to carry out the study. Data needs to be gathered from respondents and this can be done in two ways:
- Primary: This is information collected first hand from the respondent in the form of a survey. The techniques used are:
- Personal or telephonic interviews
- Paper or electronic questionnaires
- Secondary Data: This is pre collected data and can be obtained either from external sources such as trade associations, government, etc or from within the company (proprietary information).
- Observation, i.e. recording of environmental conditions and Experiment, either laboratory or field are other research methods that can be used for data collection. Test marketing is a controlled experiment that is used to check the response to a new product or a new marketing plan. Example, a new brand of shampoo by P&G will be released for a limited time only in a few cities to check the anticipated acceptability within the country once launched full fledged. If the reviews from the small sample of respondents are positive, the shampoo will be released in the market. Else, it will either be shelved off or modified taking inputs from the respondents.
- Data can be gathered from respondents by any of the methods described above depending on their applicability. But data has to be collected from a sufficient number of people for it to be valid and reliable. This ‘ideal’ number of people is called the sample which is nothing both a subset of the target population. Generally, the more the number of people taken in the sample, the more precise the outcome will be. However, random people cannot be chosen; they have to be representative of the target population. For example, women aged 35+ should be used as respondents in the sample for an anti ageing cream brand.
Following are some of the practised ways of forming a sample:
- Convenience Sampling: Easiest way that collects data from respondents that are easily available and hence is random. For example, asking people who appear relatively free to fill out a questionnaire at a mall.
- Quota Sampling: Here people are chosen from a group in a certain proportion. For example, if a class has 100 students with a majority of girls, say 70% girls, we would include 7 girls and 3 boys for our sample of size of 10 students.
- Snowball Sampling: This sampling method is deployed when the appropriate respondents are sparse. Data is gathered from the available people and they are asked in turn to refer other similar respondents. The researcher then approaches these referred respondents and thus the chain grows.
- Cluster Sampling: The entire population is divided into clusters according to their homogeneity. The clusters themselves are diverse, but members within a cluster are similar. One member is then chosen from each cluster to form a sample. This method is typically used when the population is diverse, but each type must be accommodated and hence one representative is chosen from each group/cluster.
- After collecting the sampled data, it has to be ‘cleaned’. This is known as editing. Editing is necessary for legibility and consistency. It is a time consuming process as the data has to be checked thoroughly. For example, during data collection, the birth year of a respondent may be recorded as 1873. It has to be edited to 1973 as that is more likely.
- The edited data is then ready for coding wherein a numerical symbol is assigned to each set of data. Coding facilitates data entry into computers.
This is illustrated in the table below:
| Recorded Data | Assigned Code | | What is your level of play? | | Novice | _____ | - 1 | | Intermediate | _____ | - 2 | Expert | _____ | - 3 |
|
- This coded data is then interpreted using various statistical techniques such as regression, factor and cluster analysis, etc that will be elaborated in later chapters. The result of this analysis is patterns or findings of our research problem that have to be documented in a report. Typically, the report consists of the:
- Prefatory Parts: Title, Table of contents, Summary
- Main Body: Introduction, Methodology, Limitations, Conclusion and Recommendations.
- Appended Parts: Data collection forms, detailed calculations, general tables and bibliography.
The final report is presented to the client.


