





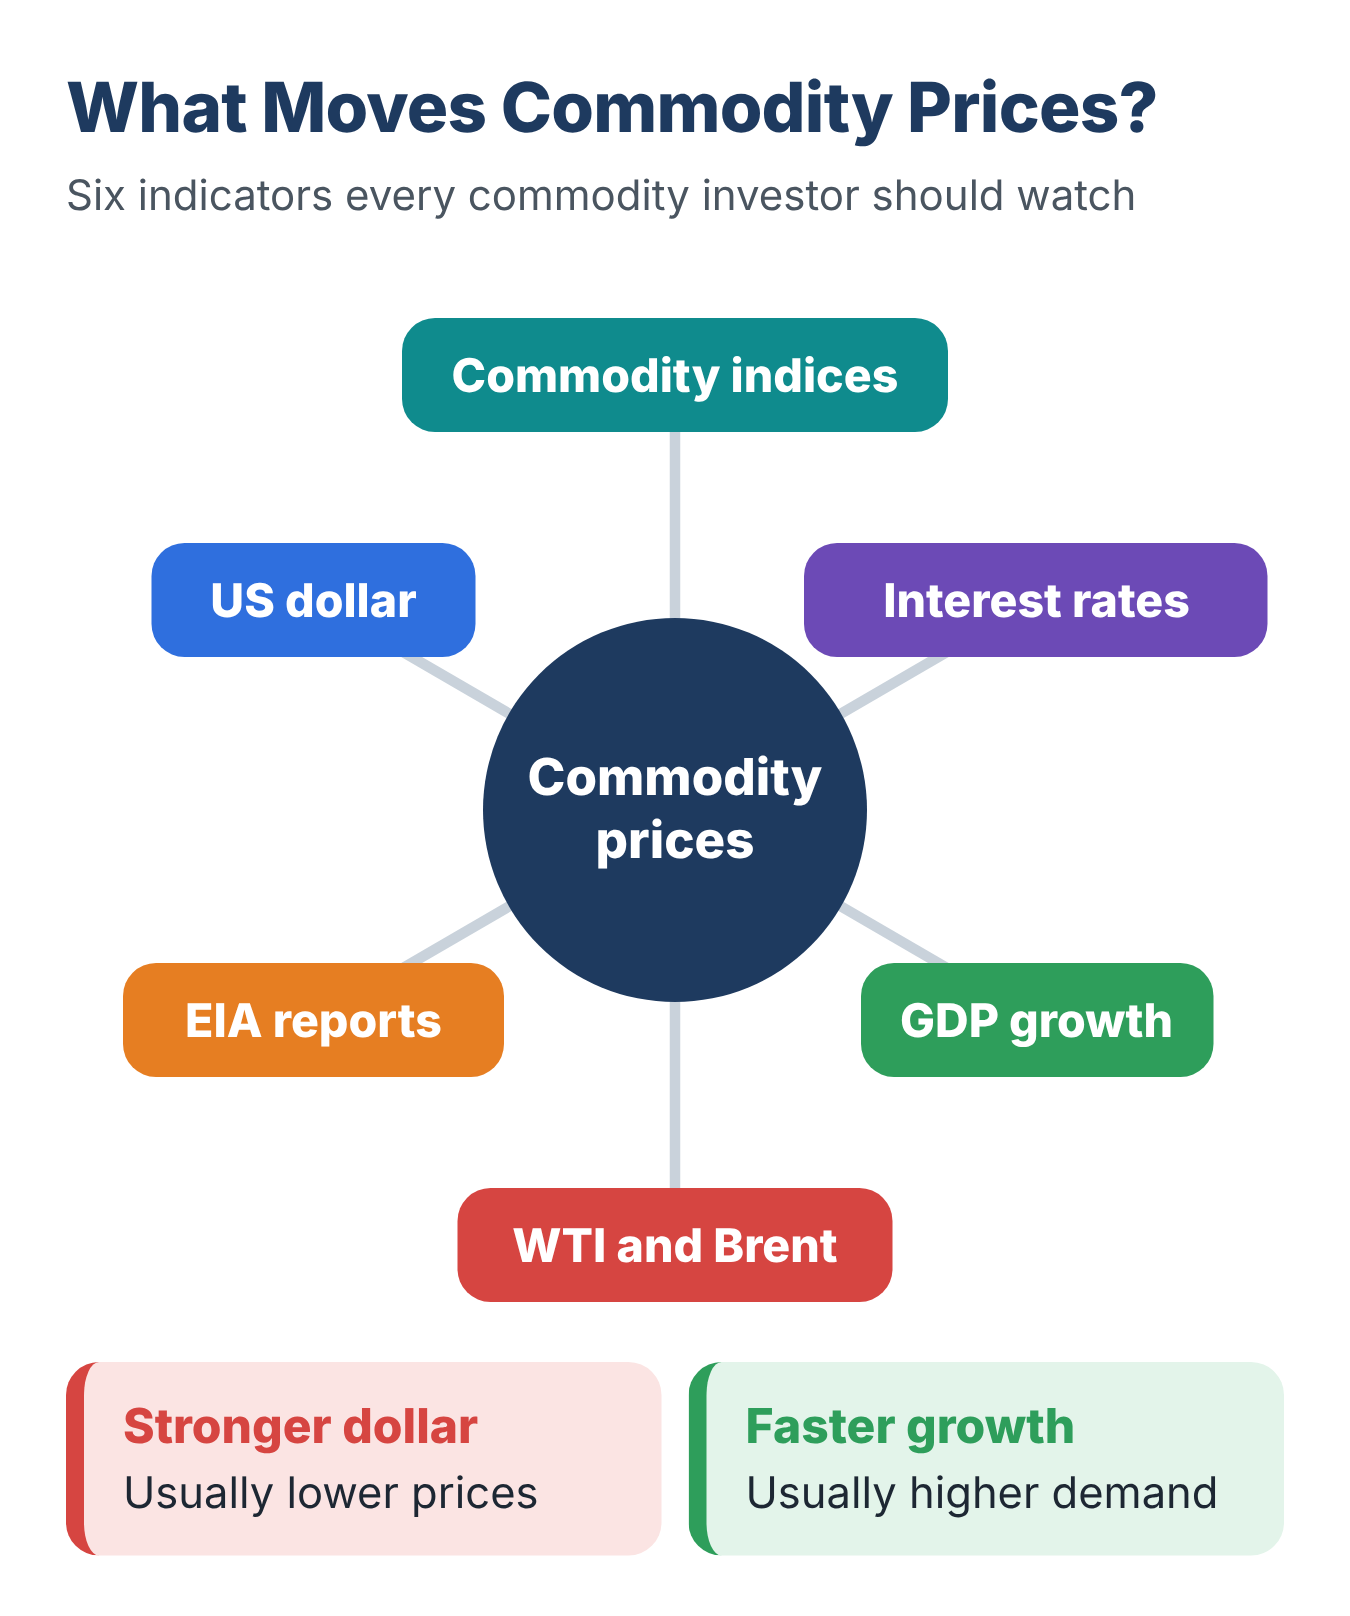
Oil jumps, gold slips, copper wobbles. Behind almost every big commodity move sits a number, a report or an index. Here is what to watch, and how to read it.
All investing runs on sentiment. Sentiment, in turn, is shaped by market indicators.
Traders watch these indicators closely. Markets often turn volatile the moment a key figure is released.
Every market has its own set of indicators. Some overlap across markets. Commodities, however, need more of them than most, because “commodities” covers everything from crude oil to copper to wheat.
This guide covers the indicators that matter most, and the commodity indices that bundle them into a single number.
Key Indicators at a Glance
| Indicator | What It Tells You | Commodities Most Affected |
|---|---|---|
| GDP | Strength of economic growth and demand | Industrial metals, energy |
| US Dollar | Price of commodities for non-US buyers | Almost all, especially gold and oil |
| Fed Funds Rate | Cost of money and level of liquidity | Gold, and most commodities indirectly |
| EIA Reports | Weekly US energy stocks and refinery activity | Crude oil, gasoline, natural gas |
| WTI and Brent | Global crude oil benchmarks | Energy, and anything oil-linked |
| Commodity Indices | Overall health of the commodities market | The whole basket |
Macro Indicators: The Big Picture
-
Gross Domestic Product (GDP)
GDP is one of the most watched economic indicators in the world. It has flaws, but nothing else summarizes an economy as well.
The link to commodities is simple. A growing economy builds more, and building needs raw materials.
Infrastructure-led economies such as India and China consume huge amounts of iron ore, steel, copper and energy. When their growth forecasts rise, commodity demand expectations rise with them.
The reverse is equally true. When China’s growth slowed sharply in the past, commodity prices across metals and energy fell with it.
Tip: Watch the growth of large importers such as China, not just the US.
-
The US Dollar
Most major commodities, including oil and gold, are priced in US dollars. That makes the dollar one of the most important numbers a commodity investor can follow.
The logic runs like this:
- Weaker dollar: commodities become cheaper for buyers using other currencies, demand tends to rise, and prices often follow.
- Stronger dollar: commodities become more expensive abroad, demand can soften, and prices often come under pressure.
Periods of aggressive money printing, known as quantitative easing, have often coincided with weak dollars and strong commodity rallies. Signals of tighter policy have often done the opposite.
The relationship is not perfect. Supply shocks and wars can override it. But ignoring the dollar is rarely wise.
-
The Fed Funds Rate
The fed funds rate is the rate at which US banks lend to each other overnight. The Federal Reserve sets a target range for it, and it acts as the benchmark for interest rates across the economy.
Its effect on commodities works through three channels:
- Liquidity: higher rates mean less cheap money, and less of it flows into commodities.
- Cost of holding: storing physical goods or holding futures becomes costlier when borrowing is expensive.
- The dollar: higher US rates tend to attract capital and strengthen the dollar, which pressures prices.
Gold is especially sensitive. It pays no interest, so rising rates make it less attractive compared with bonds.
Energy Indicators: Reading the Oil Market
-
EIA Reports
The US Energy Information Administration (EIA) is the statistical arm of the US Department of Energy. It publishes regular reports on energy supply and demand.
The United States is one of the world’s largest energy consumers and producers. So these reports move prices worldwide, even if the mainstream media covers them lightly.
Its best-known release, the Weekly Petroleum Status Report, typically shows:
- Crude oil inventories
- Domestic production and imports
- Refinery utilization
- Gasoline and distillate stocks
The report normally comes out on Wednesday at 10:30 a.m. Eastern Time. It covers the week that ended the previous Friday, so the figures look back, not ahead. In weeks with a US federal holiday, the release is usually pushed to Thursday.
Traders compare the figures with forecasts. A surprise, such as a much larger stock build than expected, can move prices within minutes.
For anyone trading energy, the EIA report is arguably the single most important scheduled release.
-
WTI and Brent
These are the two crude oil benchmarks quoted across the world.
| Feature | WTI (West Texas Intermediate) | Brent |
|---|---|---|
| Region | United States | North Sea, Europe |
| Traded on | NYMEX (part of CME Group) | ICE Futures Europe |
| Best used as a gauge of | US oil market conditions | Global and seaborne oil pricing |
Most physical oil around the world is priced off one of these two. The gap between them, called the spread, is also watched for signs of regional supply stress.
Commodity Indices: One Number for the Whole Market
Stock investors have it easy. Instead of tracking hundreds of shares, they glance at an index and get the market’s pulse.
Commodities are harder. There are dozens of them, and they have little in common. Oil, corn and copper respond to entirely different forces.
Commodity indices solve this by bundling a basket of commodities into a single number. They also give investors easy diversification. Through funds and exchange-traded products linked to an index, you can gain exposure to many commodities at once, often for a small amount.
But there is a catch. Commodity indices can perform very differently from one another. The reason lies in how each one is built.
How Components Are Chosen
Stock indices usually pick the largest companies by market value. The choice is fairly obvious.
Commodity indices have far more discretion. Some choose commodities by their economic importance, or production value. Others choose by how well they represent a sector. Gold, for instance, stands in for precious metals, and crude oil stands in for energy.
The result is that two indices can hold quite different baskets. The direction of a move may match while the size does not. One index may rise 3% while another rises 5% on the same news.
How Weights Are Decided
Weights decide how much each commodity matters inside the index. There are two common approaches:
- Production-based: the more of a commodity the world produces, the bigger its weight.
- Liquidity-based: commodities with more active futures trading, measured by trading volume, get bigger weights.
Production changes over time, so some indices reset their weights on a fixed schedule. Others let weights drift, which can add volatility.
Many indices also cap the weight of any single commodity or sector, so one market cannot dominate.
Roll Yield: The Hidden Driver
Most commodity index investors never take delivery of physical goods. The futures contracts they hold expire, so they must be “rolled” into a later month.
The price gap between the expiring contract and the next one creates the roll yield. It can help or hurt returns:
- Backwardation: later contracts cost less than earlier ones. Rolling tends to add return.
- Contango: later contracts cost more. Rolling tends to drag on return.
Over long periods, roll yield can make a big difference. Two indices tracking the same commodities can post different returns purely because they roll differently.
Major Commodity Indices Compared
| Index | Weighting Approach | Character |
|---|---|---|
| S&P GSCI (created by Goldman Sachs in 1991) | Based on world production | Heavy in energy, often around half the index, so it tracks oil closely |
| Bloomberg Commodity Index (BCOM, formerly the Dow Jones-UBS Commodity Index) | Two-thirds liquidity, one-third production, with caps on concentration | More diversified across sectors |
| CRB Index (once Reuters/Jefferies CRB) | Tiered, fixed weights across commodity groups | More balanced, with a bigger role for agriculture than the S&P GSCI |
BCOM took its current name in 2014, when Bloomberg took over the index from UBS. Its caps limit any single commodity to 15%, a commodity and its derivatives (such as crude oil and gasoline) to 25%, and any sector, such as energy, to 33%.
Index rules change from time to time, so check the current methodology with the index provider before investing.
How to Use These Indicators: A Simple Routine
- Start with the dollar and interest rates. They set the backdrop for almost every commodity.
- Check growth in major importers. China’s and India’s GDP trends shape industrial demand.
- Add sector indicators. Follow EIA reports and WTI or Brent for energy, and the relevant supply data for metals and crops.
- Choose one index as your benchmark. Then stick with it.
- Review regularly. Indicators change in importance as market conditions shift.
Worth remembering: Pick your index first and follow it consistently. Jumping between the S&P GSCI, BCOM and CRB makes numbers hard to compare, and it ruins any historical analysis.
Reading the Weekly EIA Report: A Quick Checklist
The weekly petroleum report packs dozens of numbers into one release. Reading them in a set order helps you see what the market is really reacting to.
-
Compare the result with expectations
Prices react to the gap between the actual figure and the forecast, not to the figure alone. Start with the change in US commercial crude inventories, which excludes the Strategic Petroleum Reserve.
Suppose analysts expect stocks to fall by 5.0 million barrels, but the report shows a fall of only 2.0 million. Inventories still dropped, yet they dropped 3.0 million barrels less than expected. The market often reads that as a weaker-than-expected result, and prices can slip.
-
Read crude stocks together with refinery runs
A big fall in crude stocks looks bullish on its own. But if refinery utilization jumped in the same week, refiners may simply have processed more crude. The oil has not been used up. It has turned into gasoline and diesel.
-
Check product stocks and demand
Next, look at gasoline and distillate inventories alongside “product supplied,” the EIA’s closest measure of demand. If crude stocks fall while product stocks build sharply and product supplied is flat, end demand may be weaker than the headline suggests.
Weekly figures are noisy. The four-week averages in the report give a steadier picture.
-
Watch Cushing, Oklahoma
Cushing is the delivery point for NYMEX WTI futures. Its stock levels can move WTI and the WTI-Brent spread even when national totals look calm.
Frequently Asked Questions
What is the most important indicator for commodities?
There is no single answer. For broad commodities, the US dollar and global growth (GDP) matter most. For oil, the EIA report and Brent or WTI prices matter most.
Why do commodity prices fall when the US dollar rises?
Because commodities are priced in dollars. A stronger dollar makes them costlier for buyers in other currencies, which can reduce demand and push prices down.
What is the difference between WTI and Brent?
WTI reflects US crude and trades on NYMEX. Brent reflects North Sea crude and is the main reference for internationally traded oil.
Why do commodity indices give different returns?
They choose different commodities, use different weighting methods, and handle roll yield differently. Even with the same market moves, results can differ noticeably.
What is roll yield?
It is the gain or loss from replacing an expiring futures contract with a later one. It is positive in backwardation and negative in contango.
Should beginners track all these indicators?
No. Begin with the dollar, interest rates and one commodity index. Add sector-specific indicators as you focus on particular markets.