Academicians and practitioners from all over the world have been tried very hard to come up with a model which would help them to predict bankruptcy in a firm before it occurred.
In the previous article, we have already studied how the expected default frequency model was used and what its advantages and limitations were. However, it is not the only model which is used by firms to gauge how far other firms are from bankruptcy.
The Altman’s Z score model has been used extensively over the years. In this article, we will have a closer look at how the Z score model came into existence and how it can help predict bankruptcy over the long run.
History Behind the Altman’s Z Score Model
The Altman’s Z score model was developed by an American professor and researcher at the Stern University in 1968. However, it would be unfair to say that Altman’s Z score model was indigenously built by Professor Altman. Instead, it was a result of improvements over many such previous models which were developed earlier.
The idea of predicting bankruptcy shot to prominence during the 1930s. This is because of the Great Depression when hundreds of companies went bankrupt and many times endangered the financial viability of the banks and investors that lent money to them.
Over the years, many statisticians developed models to try and predict bankruptcy using financial ratios of bankrupt companies as data points. However, most of them failed. Professor Altman was able to finally devise a model which gave accurate results. Hence, the model was named after him.
The beauty of Professor Altman’s model is that it is very simple. Earlier, Dr. Altman had decided that the Z score formula should use 22 ratios. However, over time, he realized that the results were almost the same even if 5 ratios were used instead of 22. Hence, the final Altman’s Z score is a score that is derived using a weighted average of 5 ratios.
The coefficients which are assigned to the different ratios in this formula have been derived by running rigorous statistical procedures on the data derived from bankrupt firms. Data was derived from firms that went bankrupt and which didn’t go bankrupt. The data was analyzed over different periods of time. This helped isolate the five key ratios and their coefficients which now form a part of Altman’s Z score model.
The Altman’s Z score is known for being extremely accurate. During the earlier years, when this score was launched, it had an accuracy of 72% in predicting default before it actually occurred. However, over the years, the accuracy rate has increased and now the score has a 90% accuracy rate when it comes to predicting bankruptcy.
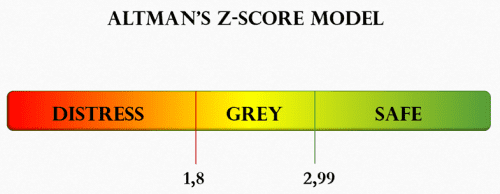
The Three Levels in The Z Score
The Z score is a score that is calculated based on the formula provided by Professor Altman. After the scores are calculated, companies are categorized into one of the three grades.
Safe Zone: Companies within this score are said to be safe from bankruptcy. Unless a black swan event occurs, there is almost zero probability that these companies would go bankrupt in the next 2 years.
Grey Zone: There are some companies that do not have a clear good score or a bad score. These companies are said to be in the distress zone. This means that there is a small probability that these companies may go bankrupt in the next 2 years.
Distress Zone: These are the companies that are struggling with their finances. They are almost certain to default on their debts in the next one year. This can be predicted if the Altman score is lower than a certain level.
The safe, grey, and distress zones are defined based on the industry. Hence, sharing their absolute values here is not meaningful.
Limitations of The Altman’s Model
Altman’s model has some limitations. However, since this model is quite old, steps have been taken to mitigate these limitations as well.
The Formula for Privately Held Companies: For instance, the Altman’s Z score is a weighted average of five key ratios. Some of these ratios depend upon data from stock markets. This is the reason that the model was initially not effective for private companies. However, over time, Professor Altman created another model for privately held companies. It is called the Z’ model (Z dash model). It includes the same five ratios but the coefficients have been changed based on the data analysis done for private companies.
Non-Manufacturing Companies: The Altman Z score had been developed at a time when manufacturing companies were the dominant players. Hence, it was more suitable for them. However, over time, non-manufacturing companies have become dominant in the economy.
Today, most of the top companies in the world are asset-light. Hence, to make sure that the model adapts to this changing reality, another version of the model called Altman’s Z’’ (Z double dash) model was developed.
In this model, the ratio which takes into account the total assets of the firm has been removed and the coefficients of other ratios have been changed in order to reflect the realities of the service industry.
The bottom line is that the Altman’s Z score is a valuable model which can be used to find out the creditworthiness of another firm. It has been used for decades to manage exposure and reduce the probability of credit loss. However, it cannot be used alone. It needs to be used in conjunction with other models in order to ensure that the right decision has been taken.
Himanshu Juneja, the founder of Management Study Guide (MSG), is a commerce graduate from Delhi University and an MBA holder from the esteemed Institute of Management Technology (IMT). He has always been someone deeply rooted in academic excellence and driven by a relentless desire to create value. Recently, he was honored with the “Most Aspiring Entrepreneur and Management Coach of 2025 (Blindwink Awards 2025)” award, a testament to his hard work, vision, and the value MSG continues to deliver to the global community.
Himanshu Juneja, the founder of Management Study Guide (MSG), is a commerce graduate from Delhi University and an MBA holder from the esteemed Institute of Management Technology (IMT). He has always been someone deeply rooted in academic excellence and driven by a relentless desire to create value. Recently, he was honored with the “Most Aspiring Entrepreneur and Management Coach of 2025 (Blindwink Awards 2025)” award, a testament to his hard work, vision, and the value MSG continues to deliver to the global community.
Himanshu Juneja, the founder of Management Study Guide (MSG), is a commerce graduate from Delhi University and an MBA holder from the esteemed Institute of Management Technology (IMT). He has always been someone deeply rooted in academic excellence and driven by a relentless desire to create value. Recently, he was honored with the “Most Aspiring Entrepreneur and Management Coach of 2025 (Blindwink Awards 2025)” award, a testament to his hard work, vision, and the value MSG continues to deliver to the global community.
Leave a reply
Your email address will not be published. Required fields are marked *